

Required permission:
- Add dashboard
Create a dashboard
- Open Analytics › Dashboard and click New.
- Type a Dashboard name.
- Click a template.
- Click Preview dashboard.
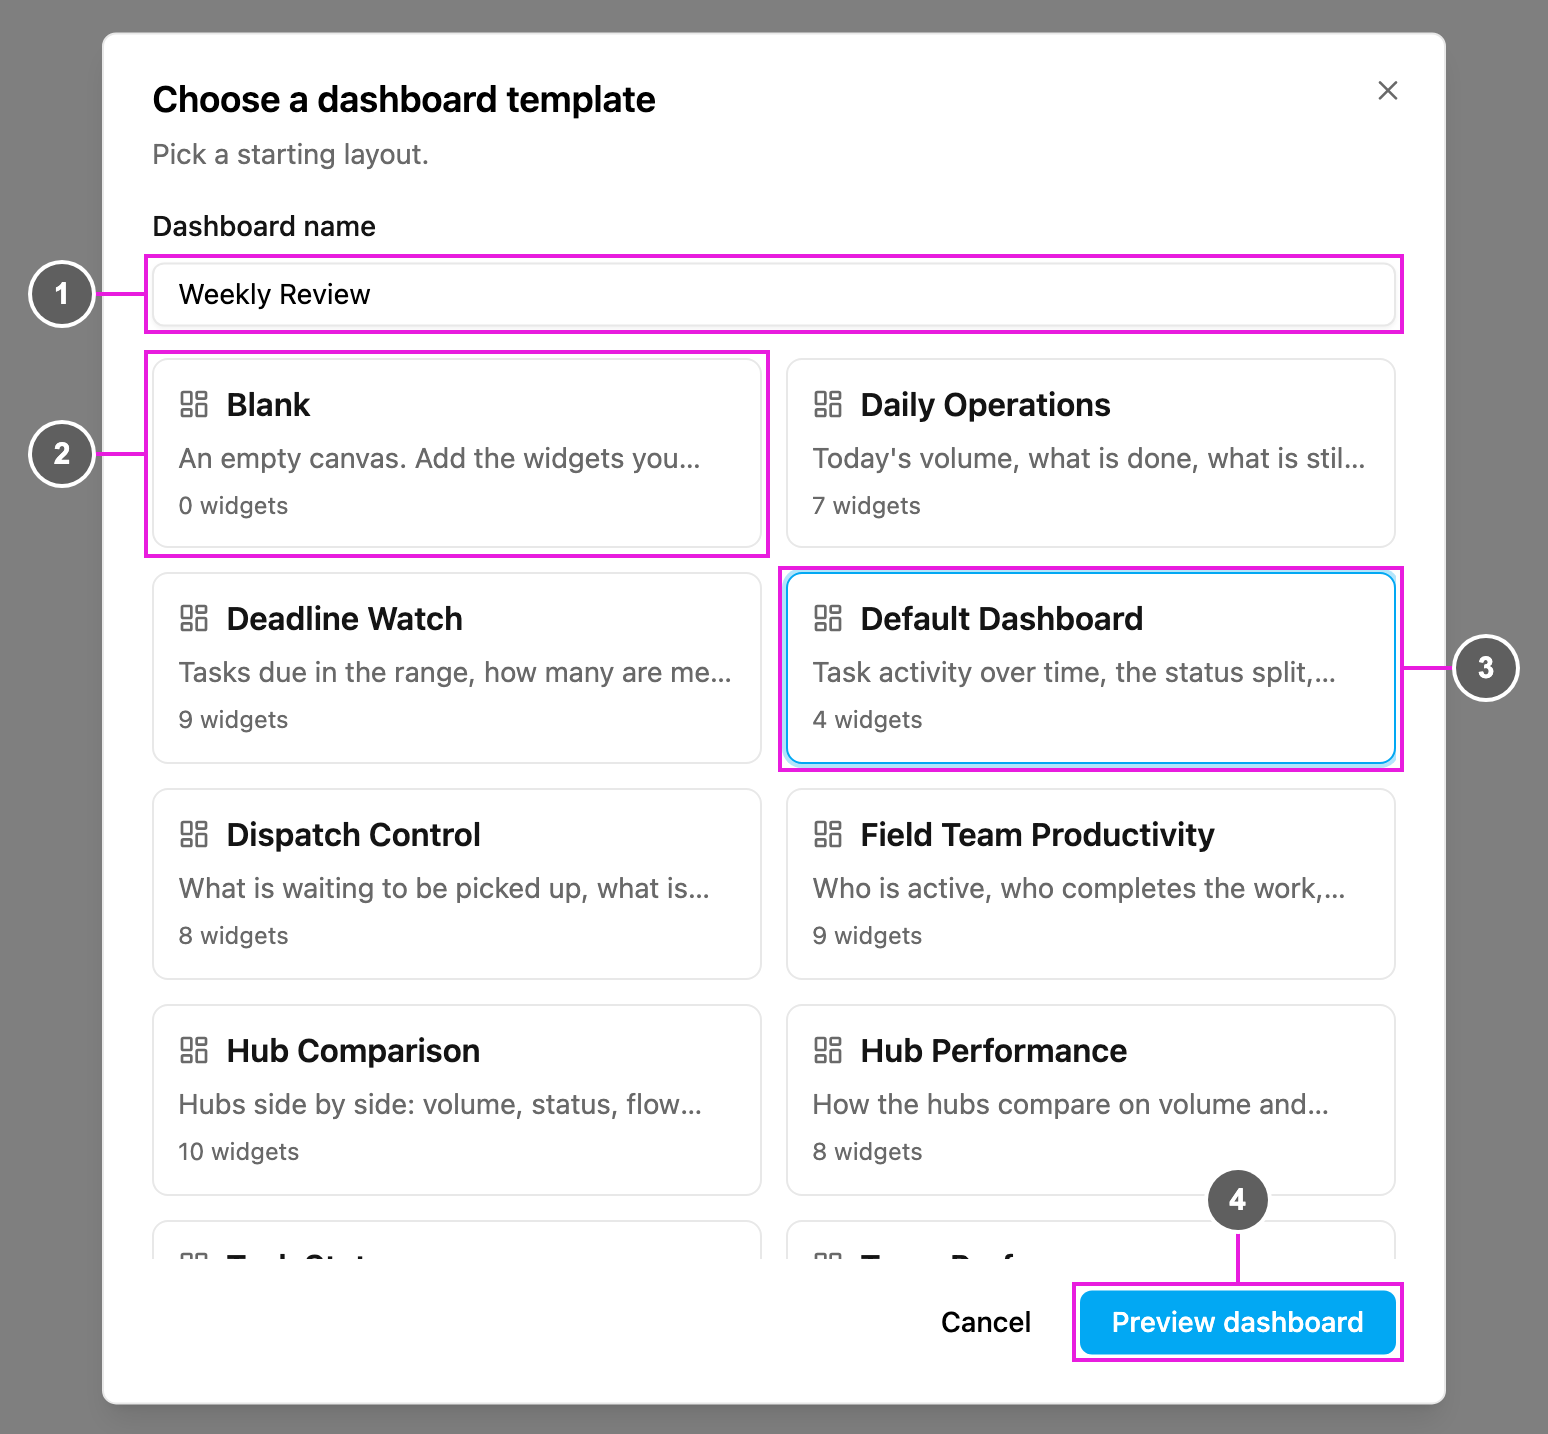
- Dashboard name: the name shown in the dashboard list, for example Morning operations.
- Blank: an empty canvas, to add only the widgets you want.
- Selected template: the template you picked. Each card shows the template’s name, what it is for and how many widgets it has. Default Dashboard is picked when the dialog opens.
- Preview dashboard: open the layout with your own numbers.
Templates
Widget names that say Flow count by task type. Every widget is described in Dashboard Widgets.
Which template to start from
- Daily Operations: a morning check of today’s volume and what is still open.
- Deadline Watch: whether tasks are finished before their end time, and where overdue work sits.
- Default Dashboard: the four charts of the previous version’s task dashboard.
- Dispatch Control: for dispatchers, who need to see unassigned and stalled work and who carries the open tasks.
- Field Team Productivity and Team Performance: workload, completions and travel time per person.
- Hub Comparison and Hub Performance: hubs side by side, with a heat map of where tasks are done.
- Task Status: the status split and completion per hub.
- Travel Time: how long field staff spend travelling, per hub and task type.
- Weekly Review: week-by-week volume and completions, with status by task type and by label.