

Required permission:
- Add report (to create a report)
- Edit report (to change a report)
Create a report
- Open Analytics › Report.
- Click New. The Create report dialog opens.
- Fill in the fields below, then click Save. The app says Report ”…” created.
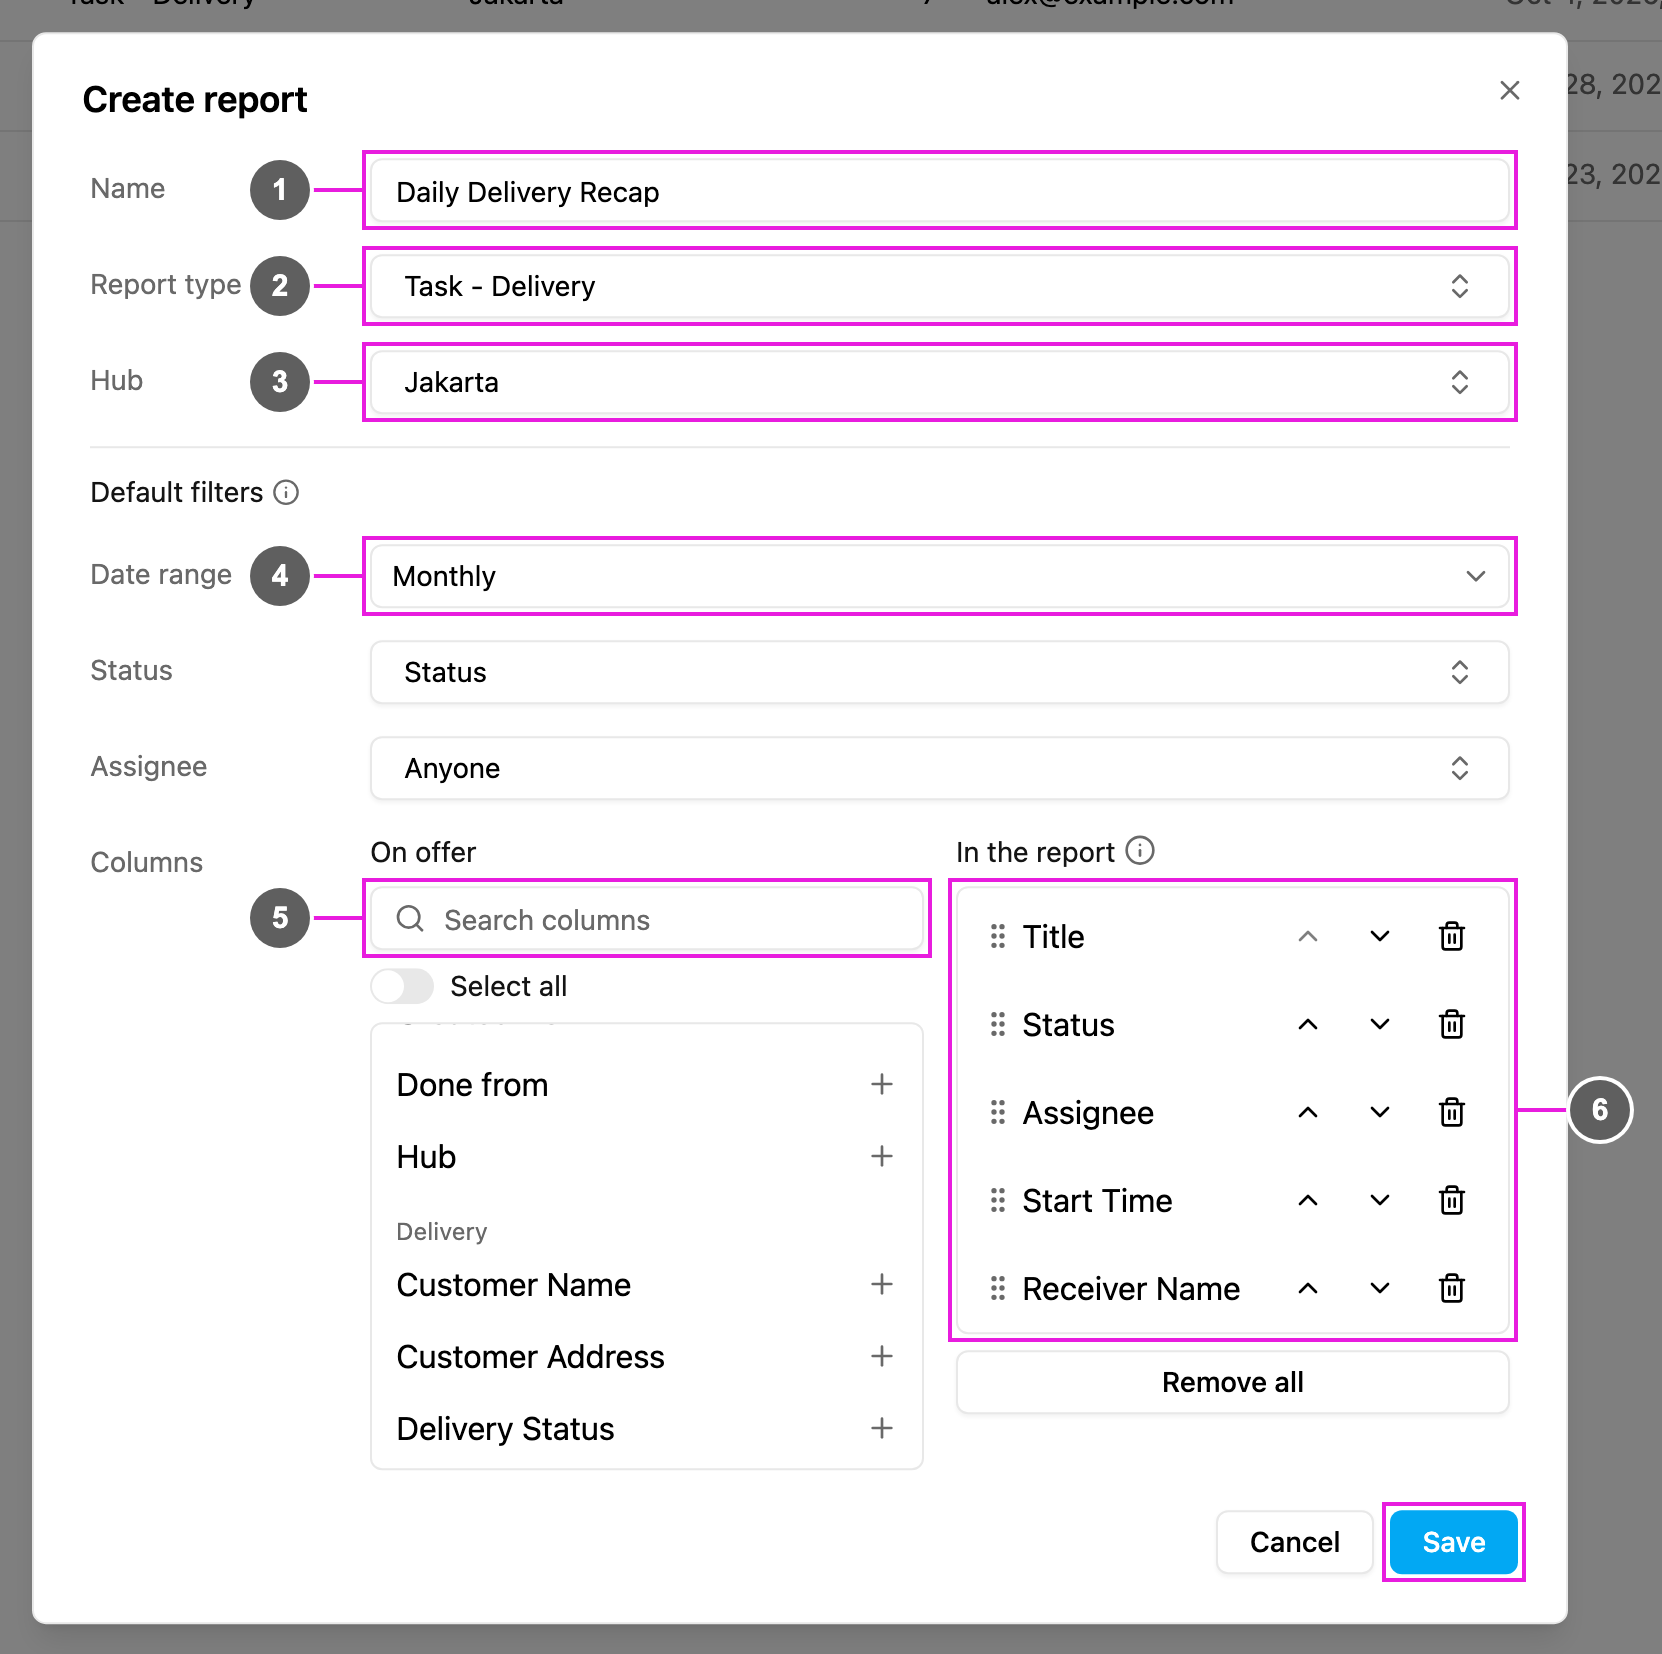
- Name: the report name, for example Daily Delivery Recap.
- Report type: the task type or data type the report reads. Task types show as Task - Delivery, data types as Data - Stores. Use the search box to find one.
- Hub: the hubs whose records the report shows. Pick one or more, or use Select all hubs. A shared data type has no hubs, so this field is hidden for it.
- Default filters (task reports only): the filters the report starts with each time it is viewed or exported. You can still change them on every run.
- Date range: Daily (today), Weekly (the last 7 days) or Monthly (the last 30 days). The range always ends today and is matched against the task’s start time.
- Status: show only tasks with these statuses. Leave it empty to show every status.
- Assignee: show only tasks assigned to these people. Leave it on Anyone to show every task.
- Columns › On offer: the columns you can add, with Search columns to find one and Select all to add every column. For a task type, Standard Columns (title, status, assignee, times, hub and so on) are listed first, then the fields of the task type under its name. For a data type, every field of the data type is listed. Click + next to a column to add it.
- Columns › In the report: the columns the report shows. Top to bottom is left to right in the view and in the exported file. Drag a column by its handle, or use the up and down arrows, to change the order. Click the trash icon to remove a column, or Remove all to start over.
Which fields can be columns
Task reports offer the same fields as the task table, plus bill and list answers. A bill or list cell shows a summary (for example 2 items · 223,000) that opens the full answer. Photos, signatures and other files aren’t offered as columns.Edit a report
- Click ⋯ on the report, then Edit.
- The Edit report dialog opens with the report’s current settings. Change what you need.
- Click Save. The app says Report ”…” updated.